What's New in IP 2025

At Geoactive, we are always aiming for excellence. With nearly 30 years of continuous software innovation, our dedication to building the best subsurface analysis tool on the market remains steadfast.
The latest version of Interactive Petrophysics (IP) features significant performance and user experience enhancements, benefiting all users, current and new. Plus, we've introduced two new modules and made various improvements to our most popular existing ones.
IP is now more enhanced, durable, and prepared for the future.
User Experience Improvements
We've added a whole host of new features making everyday tasks easier such as:
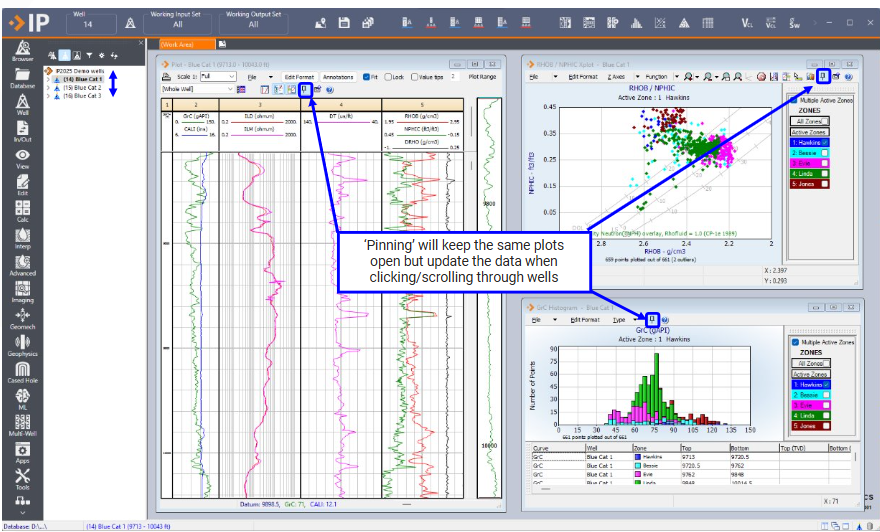
New 'Pin' buttons added to Logplots, X-plots and Histograms. When pinned, as users scroll through wells, the plots will automatically refresh to show the current well. This enables users to explore wells while viewing data in a uniform display format.
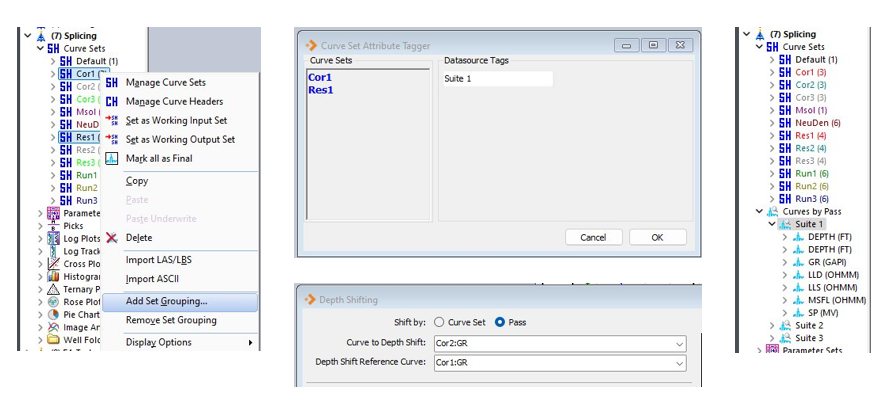
Grouping for Sets & Wells
Within IP's data browser, users can now group wells together under one parent well name, which is great for bringing main and sidetrack wells together or combining individual Date-Time and Depth datsets under one well name.
Users can also organize several Curve Sets in the Browser into a Curve Set Group, this means data can be displayed by Run, Trip, Pass or any other category the user defines rather than just by curve set name.
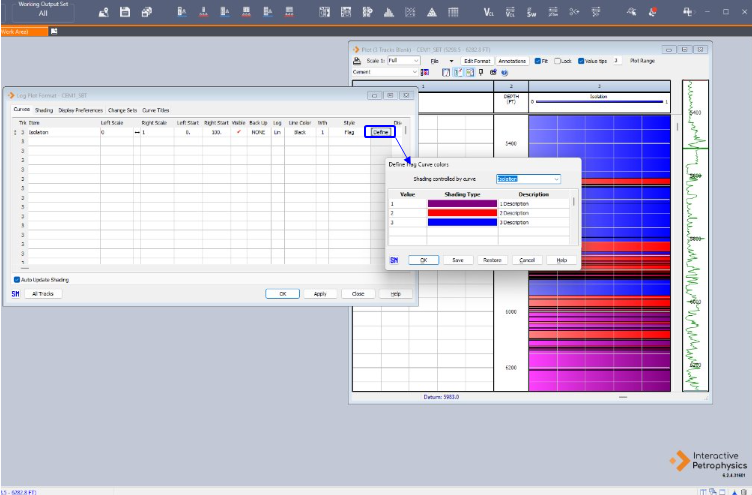
Flag Curve Controls
Flag curves color the track based on the curve's value. Previously, they were only utilized in plots generated by advanced modules, not as an independent plot style.
In IP 2025, users can now independently define the flag colors within a stand-alone logplot, without relying on any module.
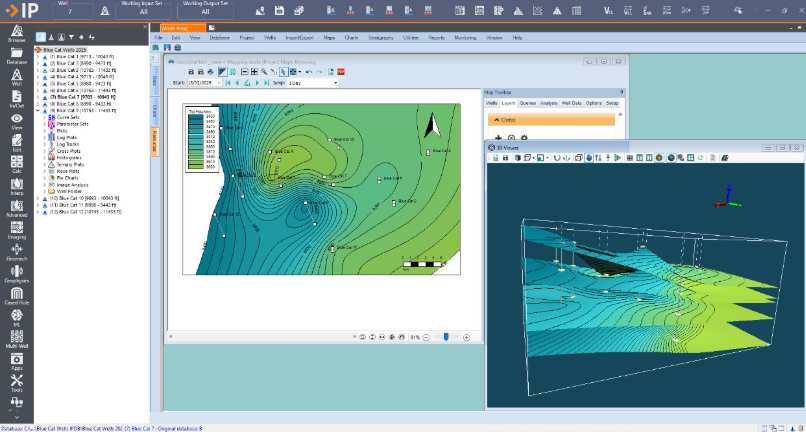
NEW Module - Mapping
Select the new Mapping option from the View menu or launch straight from the 3D Petrophysics and access a whole range of new mapping functionality and features for IP.
Seamlessly incorporate seismic surfaces and faults, effortlessly add GIS shapefiles, create zonal analyses (Bubbles, Analysis Sticks, Terminal Events), query and visualize spatial distribution, and sketch polygons and lines to improve spatial interpretations.
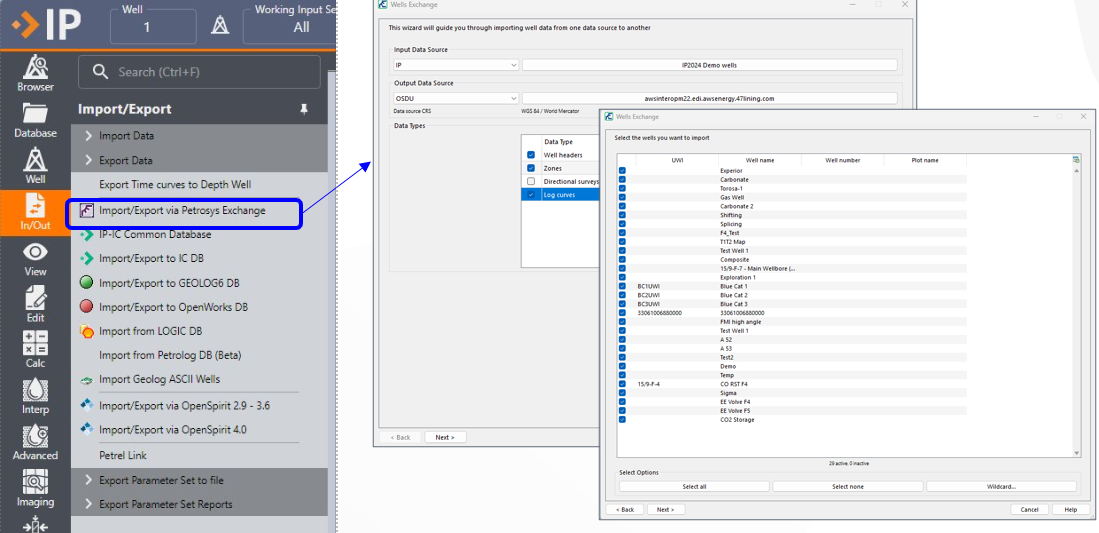
NEW Module - Petrosys Exchange
A new connector that enables users to transfer data between IP and instances of the Open Subsurface Data Universe (OSDU). Allows the copying of well header details, formation tops and log curves in both directions.
But that's not all... Exchange also allows data transfer between IP and a wide variety of third-party Geoscience software packages such as Petrel, Openworks, Petrosys and more.
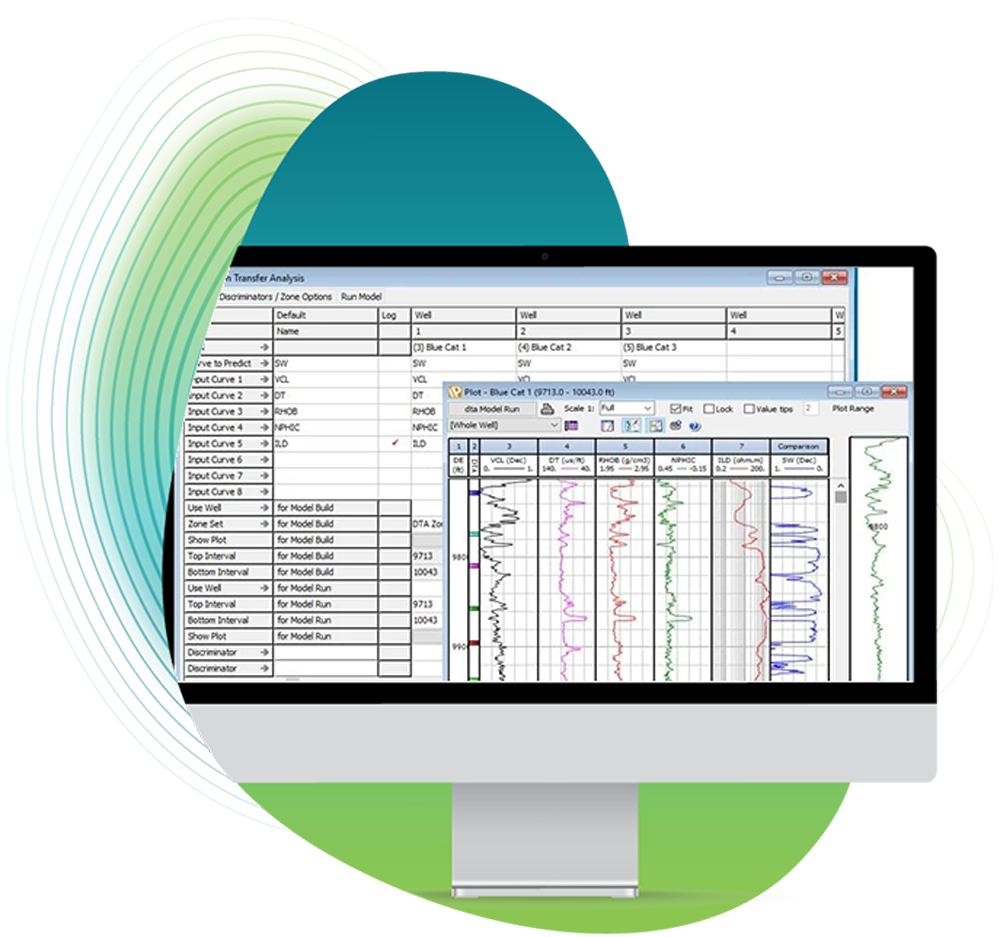
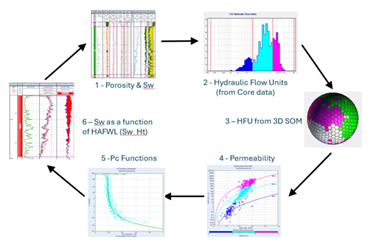
Better Reservoir Characterization
IP’s multi-module workflow for advanced reservoir characterization just got more powerful. We can now evaluate the uncertainty of our results by running Monte Carlo processing on all the modules in the entire workflow including Porosity & Sw, Hydraulic Flow Units, Saturation Height Analysis and Self Organizing Maps. By running 1000’s of iterations of the full workflow each with slightly varying parameters we can calculate P10, P50, P90 and understand the overall uncertainty in the results.
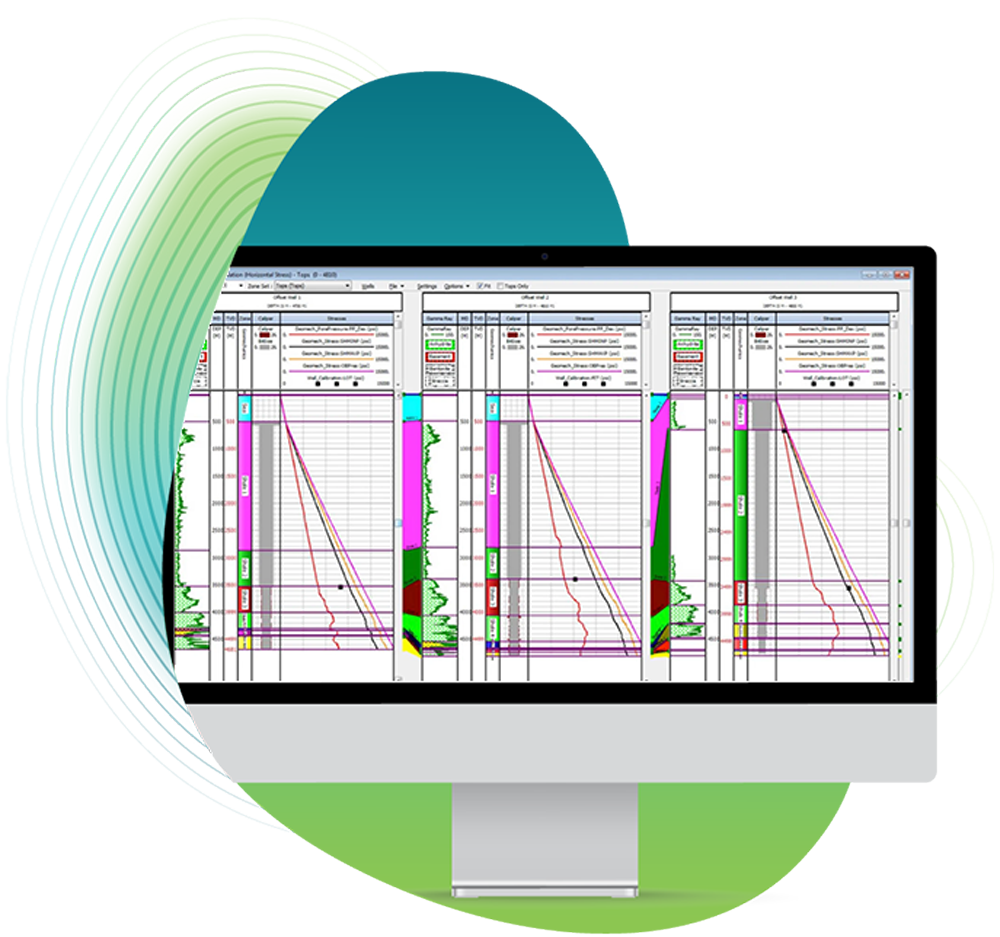
Geomechanics Advances
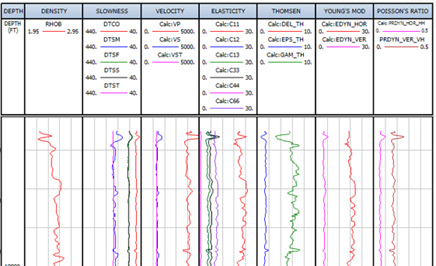
Our Geomechanics workflows have been further enhanced with the addition of an new Anisotropic Elastic module which calculates Rock Properties from Sonic data.
Outputs are the elastic stiffness matrix, the Thomsen anisotropy parameters, vertical and horizontal Young’s Moduli and Poisson’s Ratios, and their effects on the horizontal stresses.
Toolkits